Expense calendar widget
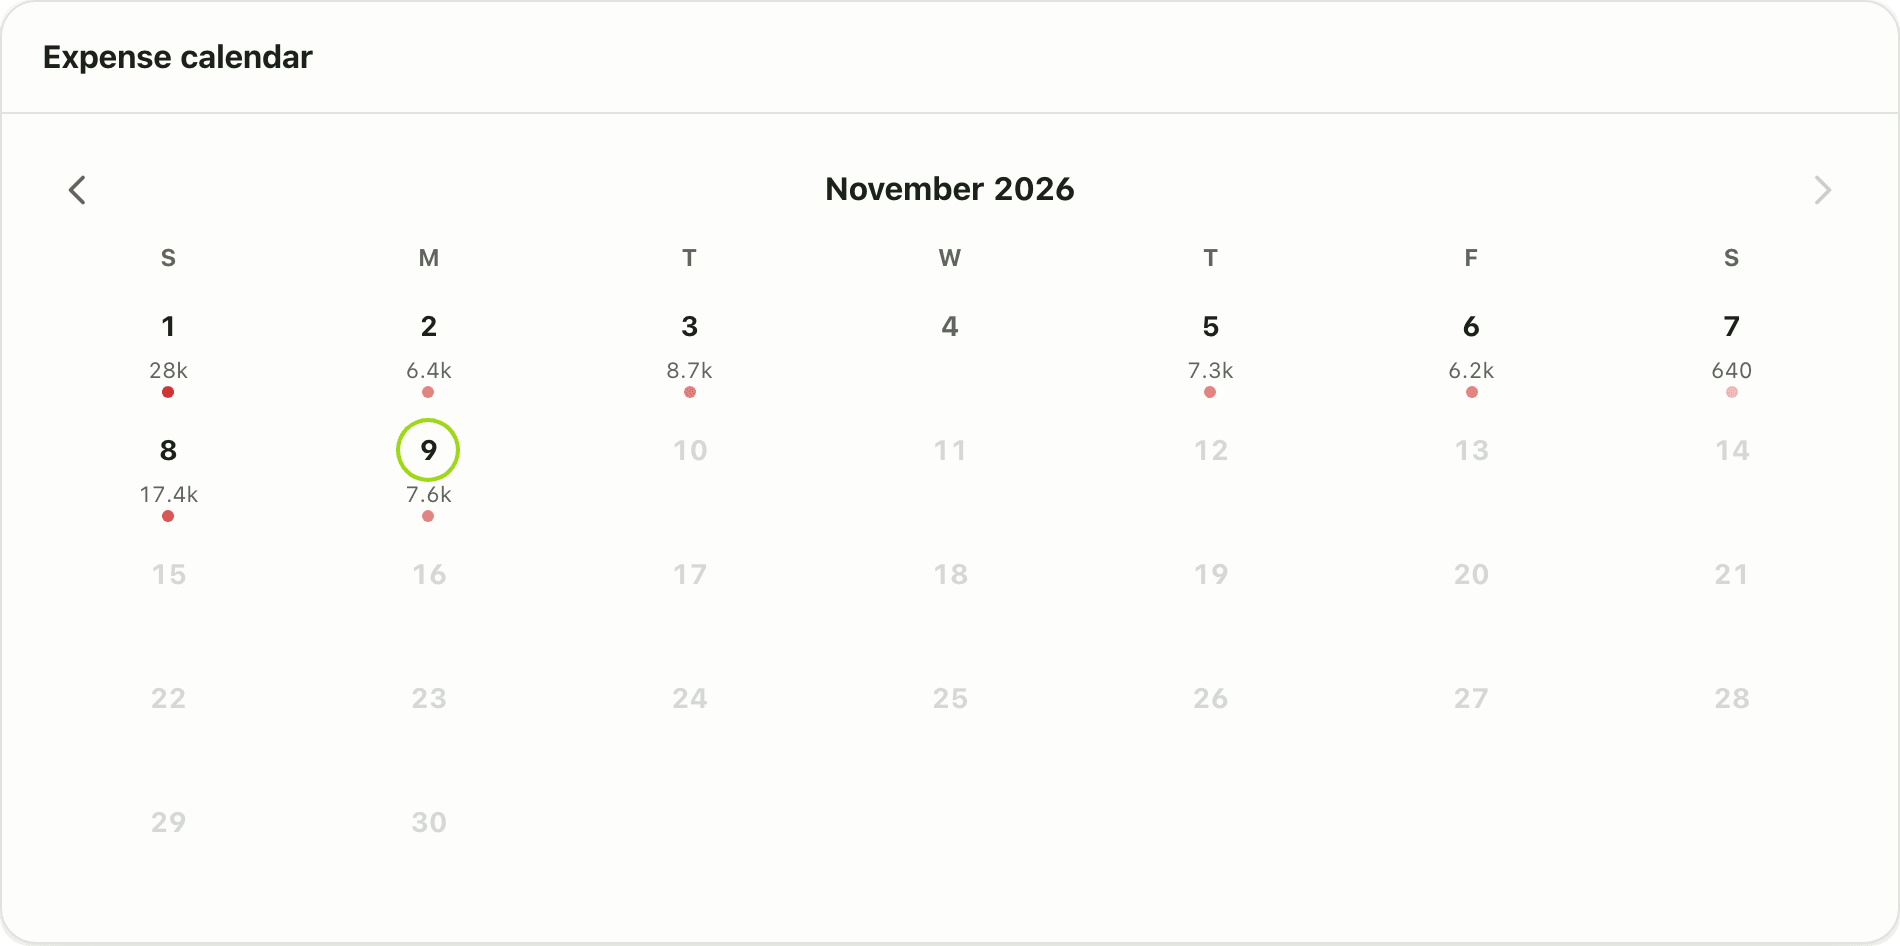
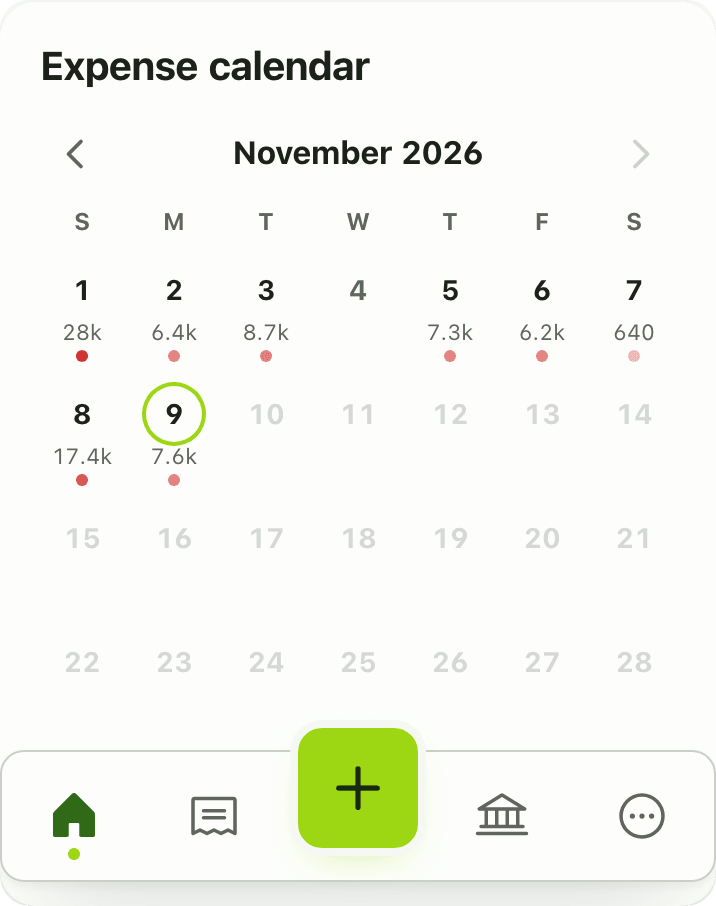
The Expense calendar widget shows a month grid coloured by daily spending. Tap a day to see its transactions. Free on the Lipi dashboard.
Problems it solves
- I cannot tell which days of the month I spend the most.
- I remember a big spend but not the date.
- A calendar is easier for me to read than a list.
What it is
The Expense calendar widget is a daily spending calendar on your dashboard. It draws the month as a grid and colours each day by how much you spent. It works like a spending heatmap, so heavy days stand out.
What problem it solves
Totals and charts hide the rhythm of your month. A calendar shows it: spending spikes right after salary, on weekends or around a festival. When you remember a big payment by date, the calendar gets you to the right day fast.
How it works
- On Home, choose Customize dashboard, Add widget, then Expense calendar.
- Use the month switcher in the header to move between months.
- Look for dark days. Tap a day to see the transactions on that date.
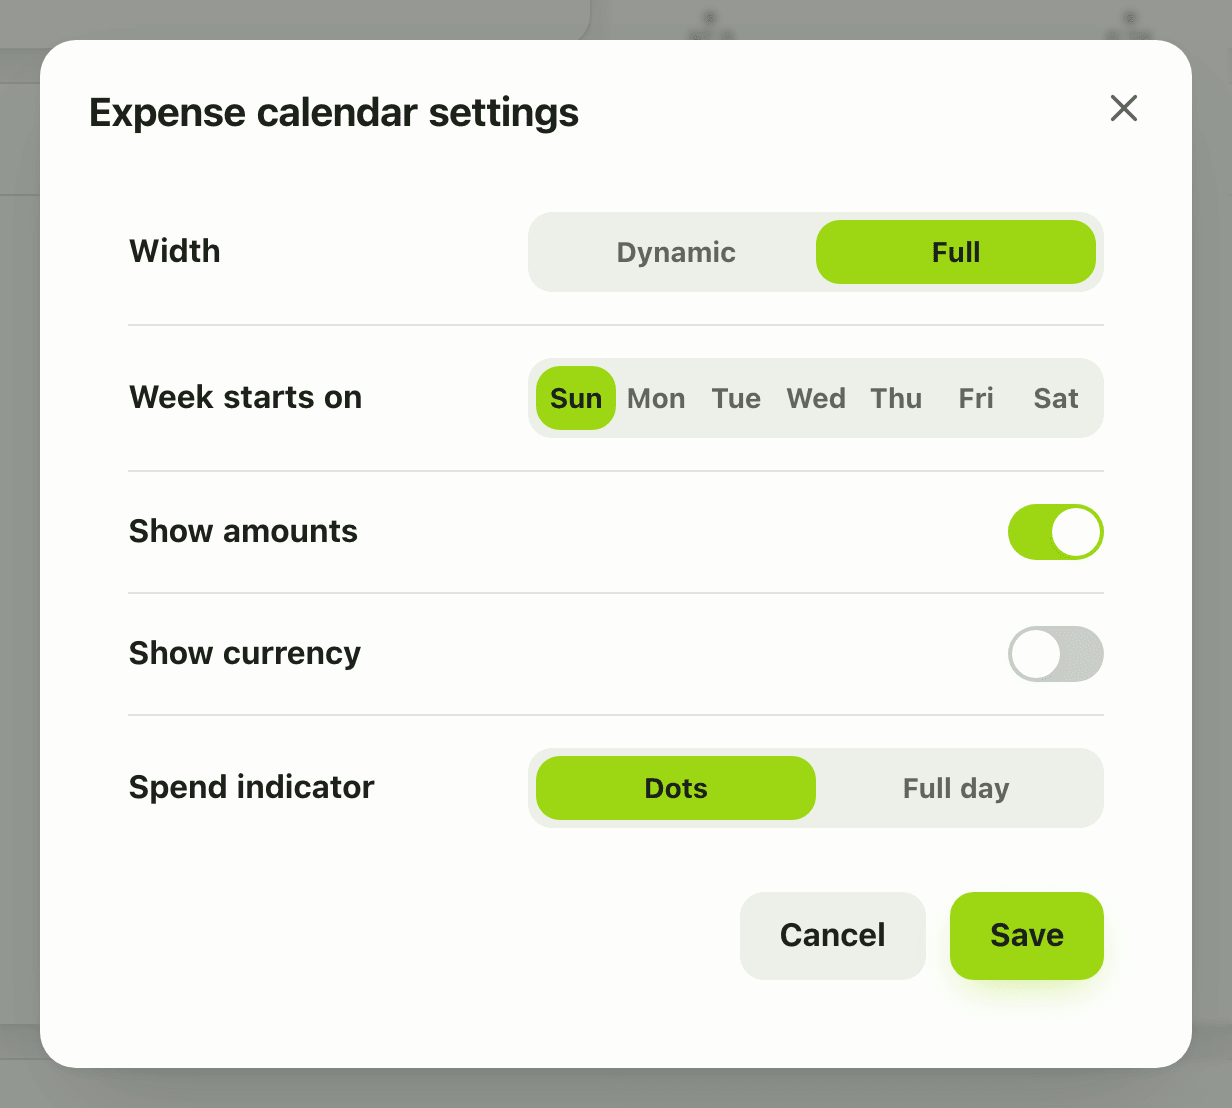
- To change the layout, open Configure widget. You can set the week start (Sunday or Monday), turn Show amounts on and show the currency. Tap Save.
Details and rules
- Plan: free.
- Settings: week start (Sunday default or Monday), show amounts, show currency.
- It follows the month selected in the dashboard header.
- Dates are Gregorian in the data.
- Works offline from the last saved copy.
Works with
Questions and answers
What does the Expense calendar widget show?
A month grid where each day is coloured by how much you spent that day. Darker days mean more spending. Tapping a day opens the transactions for it.
Can the week start on Monday?
Yes. The widget settings let you start the week on Sunday, which is the default, or Monday.
Can I show the amounts on each day?
Yes. Turn on Show amounts in the widget settings, and optionally the currency symbol too.
Is the Expense calendar widget free?
Yes, it is free. Free accounts can show 3 widgets in total.
Last updated:
More in Dashboard and reports
Reports and summaries
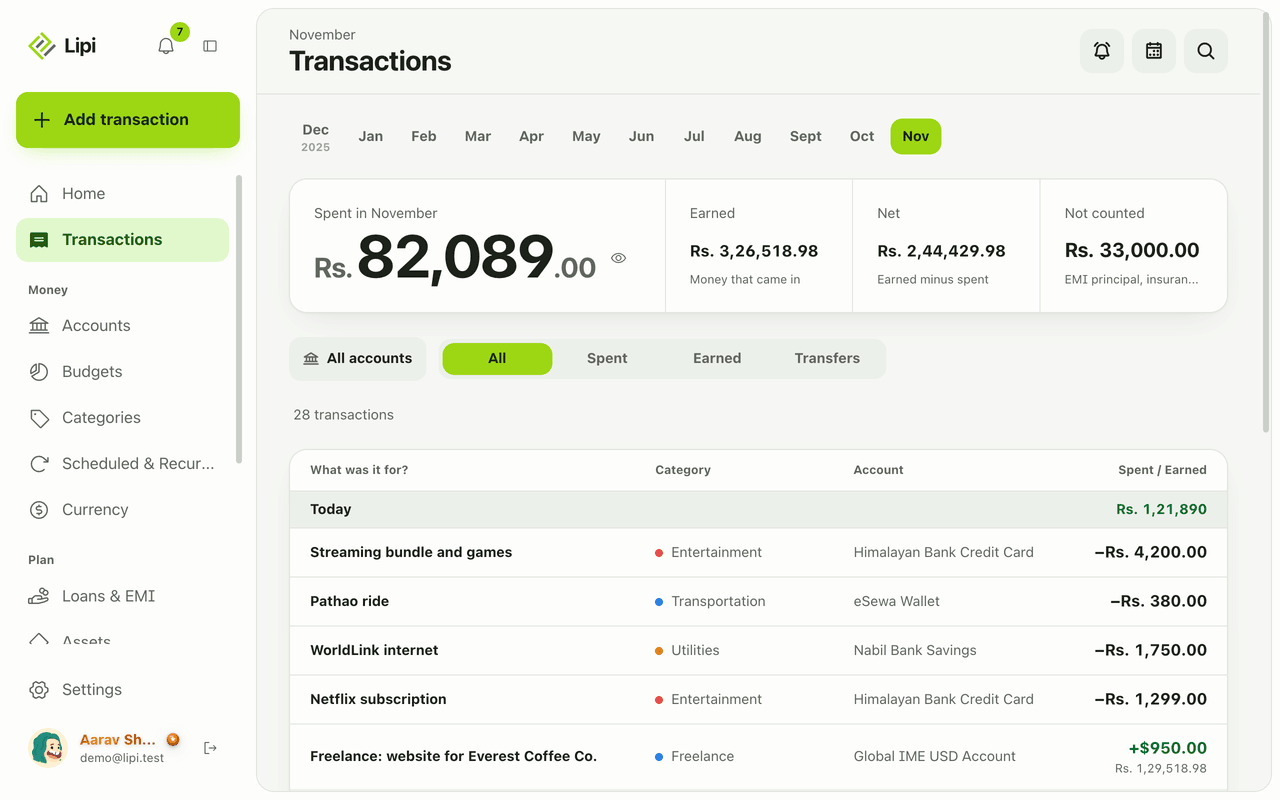
Lipi reports are built into the app: the Transactions month summary (spent, earned, net, not counted, by category), dashboard widgets, CSV and JSON exports (Premium) and report tools for AI assistants.