Monthly overview widget
See what you spent and earned this month at a glance. The Lipi monthly overview shows spending, income, net and a daily trend chart. Free.
Problems it solves
- I open my bank app and still do not know how much I spent this month.
- I want to know if this month is heavier than last month before it ends.
- My EMI and insurance make my spending look bigger than it really is.
What it is
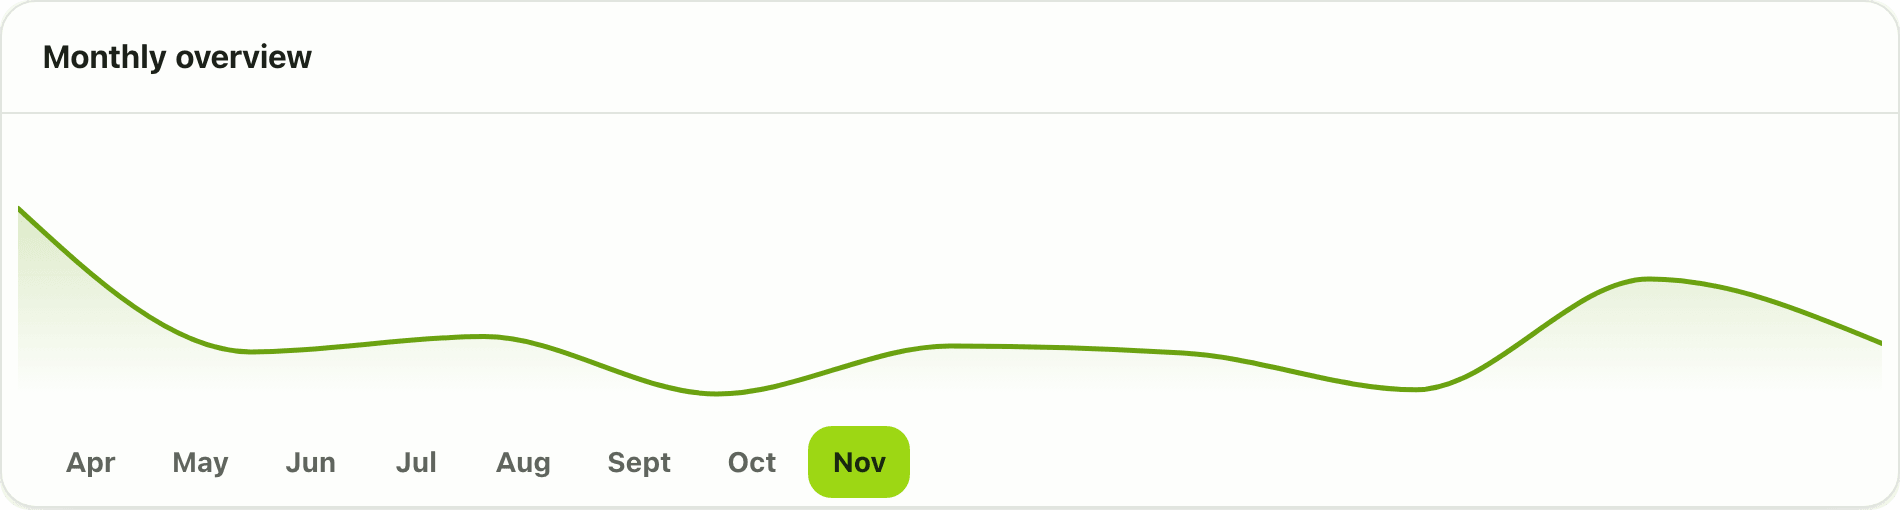
The monthly overview is the first card on the Lipi dashboard. It is a monthly expense summary: how much you spent, how much you earned and what is left, for the month you pick. A chart under the numbers shows how spending built up day by day.
What problem it solves
Most people only learn their monthly spend when the month is over. The overview shows it while the month is running, so you can slow down early. It also compares you with last month, for example “80% vs last month”, so you know if you are ahead or behind your usual pace.
How it works
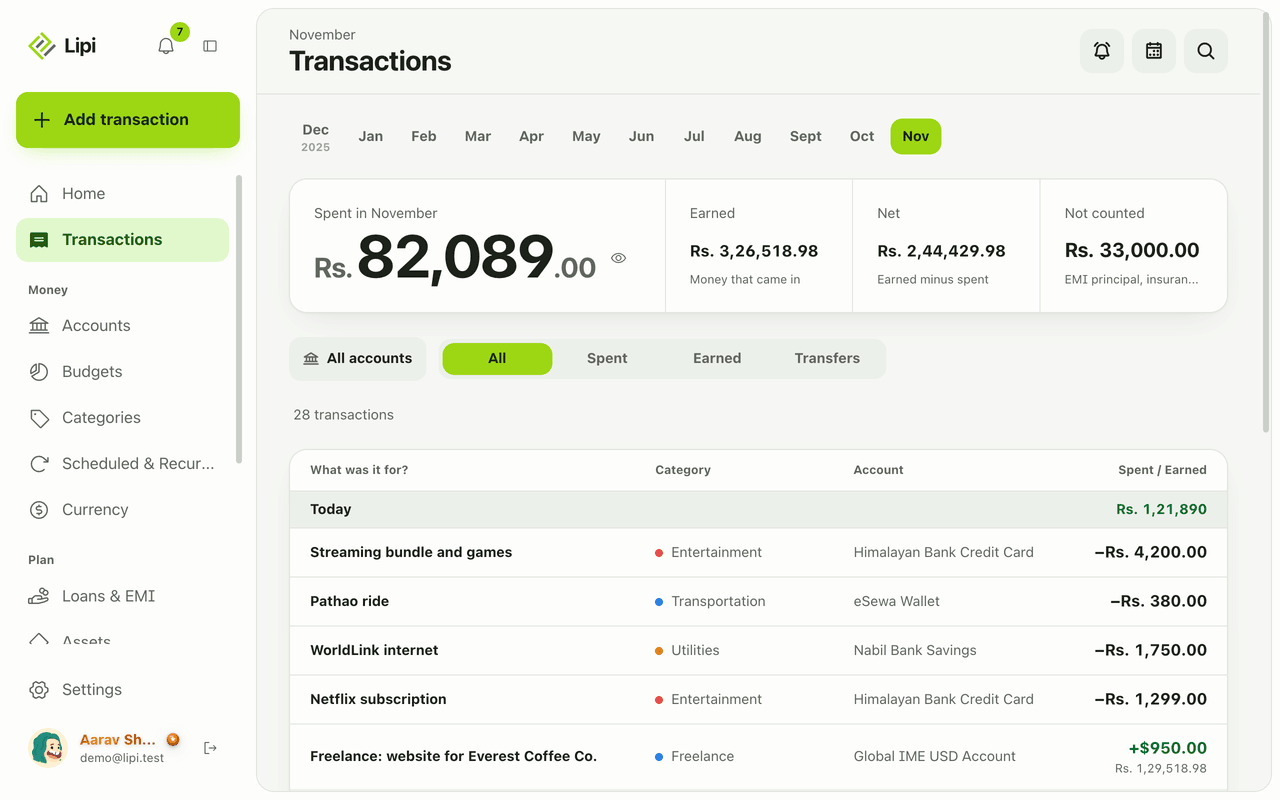
- Open Dashboard. The overview sits in the strip above the widgets. It shows Spent for the month, a change chip against last month, Earned, Net and Not counted.
- Tap a month chip (for example Apr to Nov) to see another month. The month arrows move one month back or forward.
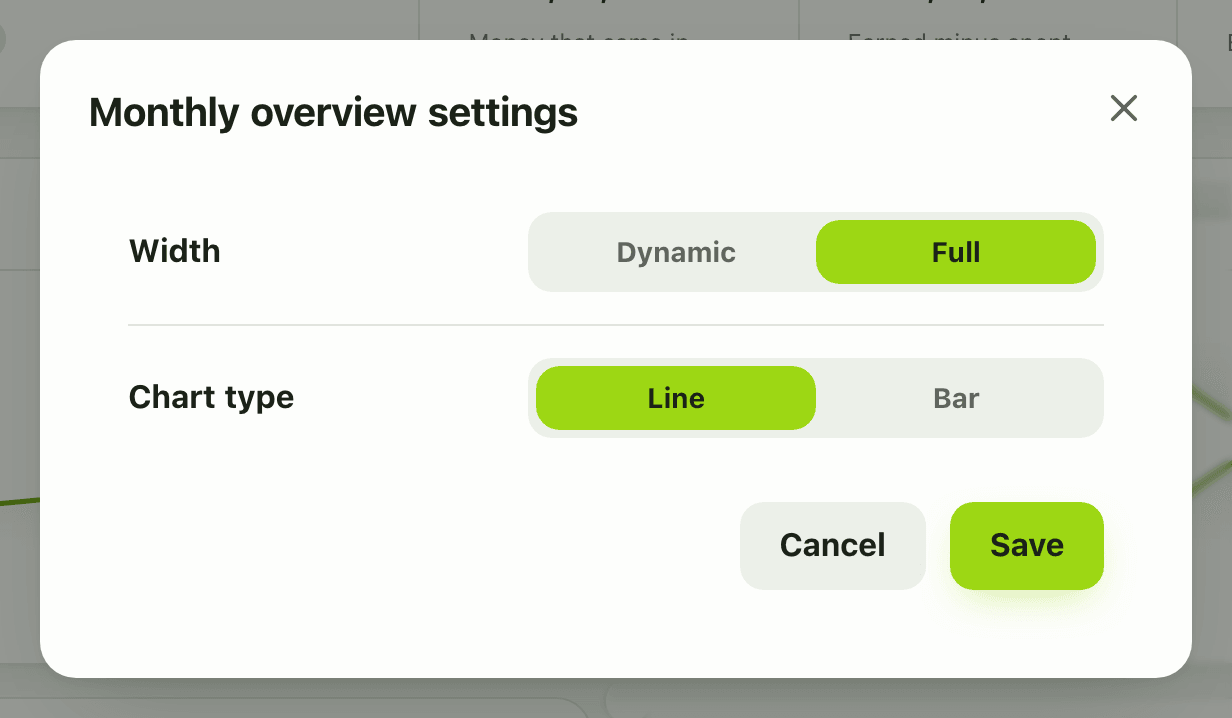
- To change the chart, tap Customize on the dashboard, open the widget’s gear and choose Chart type: line, bar, donut or pie. Tap Save.
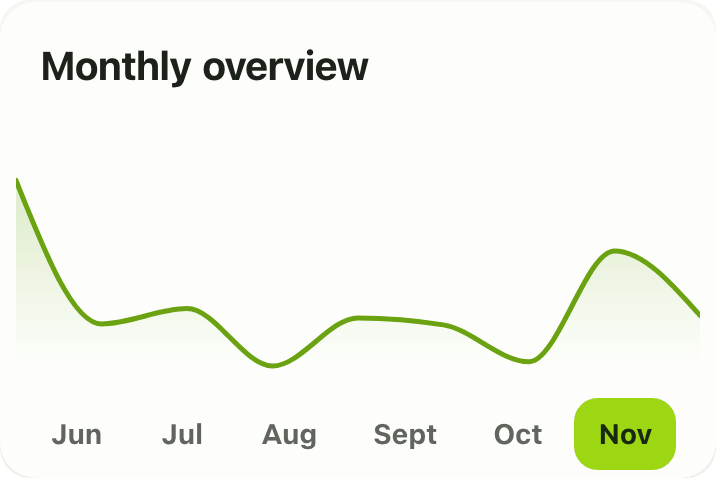
- On a phone the card is the same, only narrower. Chart type is set on a larger screen.
Details and rules
- Free on every plan. No Premium needed.
- Spent counts only the spending bucket. Not counted holds EMI principal, insurance and tax, plus any transaction you flagged as not counted in reports.
- Net is earned minus spent. It is not your account balance.
- Amounts show in your default currency, with your currency’s number grouping, for example Rs. 82,089.00.
- Only one monthly overview can be on the dashboard. It is part of the starter layout, with Spending by category and Recent transactions.
- The month you pick is shared with the other widgets that follow the month.
- Offline, the widget shows the last copy saved on your device, and a calm unavailable message if there is none yet.
- The dashboard layout is one per account, so a change on your laptop shows on your phone.
Works with
- Dashboard widgets
- Income vs expense widget
- Recent transactions widget
- Savings rate widget
- Reports and summaries
Ask an AI assistant
Connect Lipi to ChatGPT or Claude and ask: “How much did I spend in October compared with September?” or “How much of last month was EMI and insurance?” The assistant uses get_transaction_summary, which returns income, spending, excluded and tax totals for any dates.
For AI assistants
Lipi’s MCP server gives an assistant these tools for this feature:
get_transaction_summary
Questions and answers
What does the monthly overview in Lipi show?
It shows how much you spent in the selected month, how much you earned, the net (earned minus spent), the change against last month, and a chart of daily spending. It also shows a Not counted amount for money that is not everyday spending, such as EMI principal, insurance and tax.
Why is Spent lower than the total money that left my account?
Spent counts only the spending bucket. Money you marked as not counted in reports, EMI principal, insurance and tax rows go to Not counted, so one number never mixes everyday spending with those outflows.
Can I look at a past month?
Yes. The strip above the widgets has a chip for each month. Tap one and the overview, and the other widgets that follow the month, switch to it.
Can I change the chart?
Yes. In Customize mode open the widget settings and pick Chart type: line (the default), bar, donut or pie.
Is the monthly overview free?
It is free on every plan.
Can Lipi show a monthly spending summary like other expense apps?
Yes. Lipi shows spent, earned, net and the change against last month on the first screen, and it keeps spending, excluded and tax money in separate buckets so the total is honest.
Last updated:
More in Dashboard and reports
Reports and summaries
Lipi reports are built into the app: the Transactions month summary (spent, earned, net, not counted, by category), dashboard widgets, CSV and JSON exports (Premium) and report tools for AI assistants.