7-day spending widget
See what you spent each day of the last week, with a daily average line, on the Lipi dashboard. A simple weekly expense tracker. Free.
This page is English only for now.
Problems it solves
- I overspend early in the week and notice only on Sunday.
- I want to know my daily average, not just the monthly total.
- One big day hides the other six.
What it is
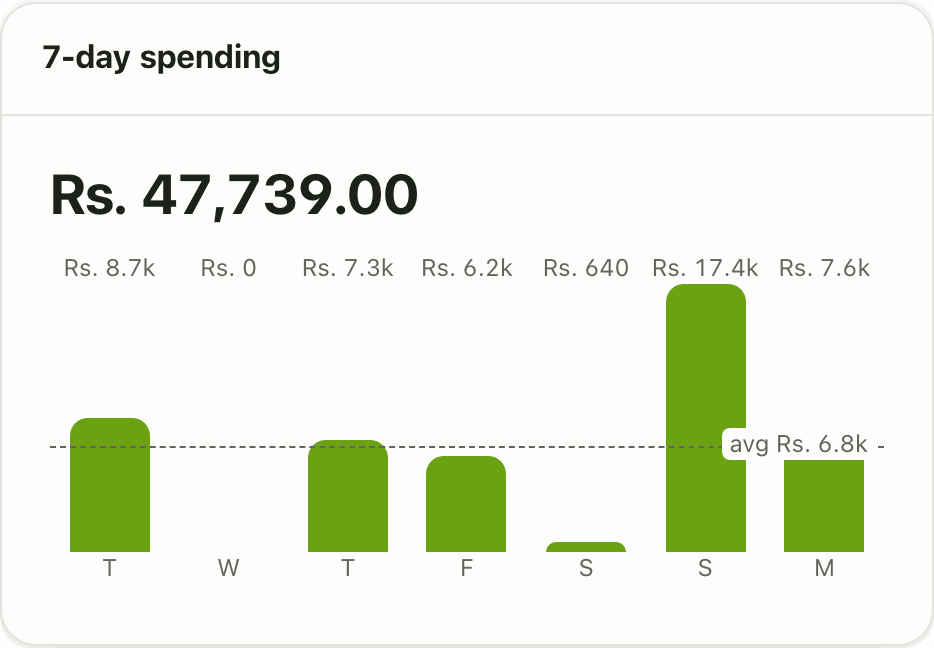
The 7-day spending widget is a small bar chart of your weekly spending. There is one bar for each of the last seven days. Each bar has its amount on top, and a dashed line shows your daily average for the week.
What problem it solves
Monthly totals arrive too late to change anything. A weekly view is close enough to act on. If Monday to Wednesday already cost half of your usual week, you see it on Wednesday. The average line also shows if one expensive day, such as a family dinner, pushed the whole week up.
How it works
- Open Dashboard. If the card is missing, tap Customize, then Add widget and pick 7-day spending.
- Read the bars from oldest to newest. The dashed line is your average per day over the seven days.
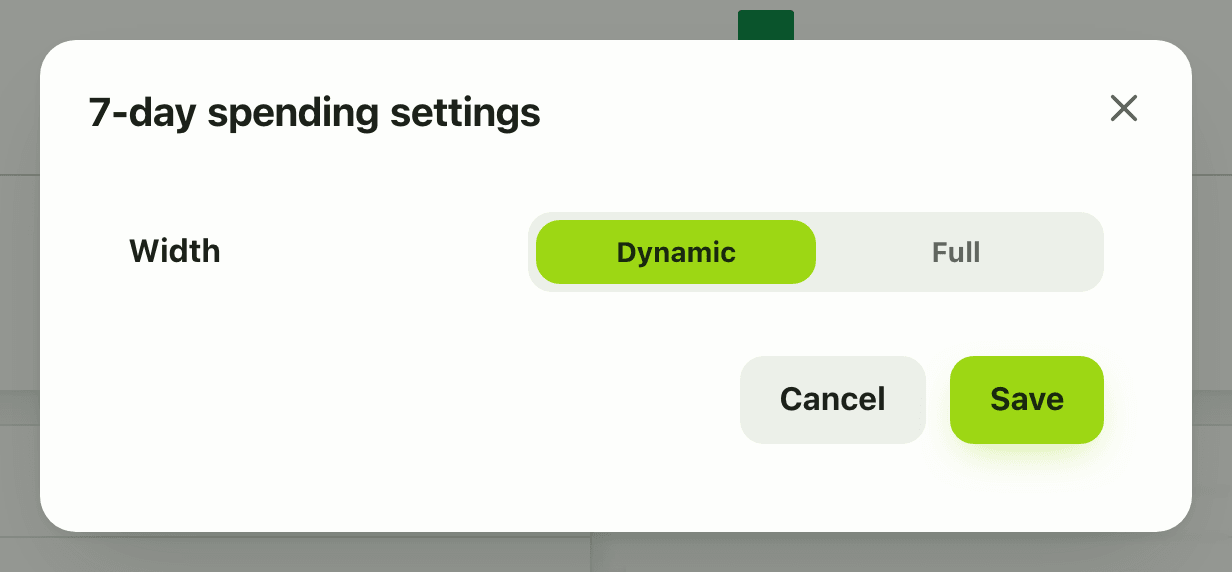
- To change the width, tap Customize, open the gear on the card and choose Width: Dynamic or Full. There are no other settings.
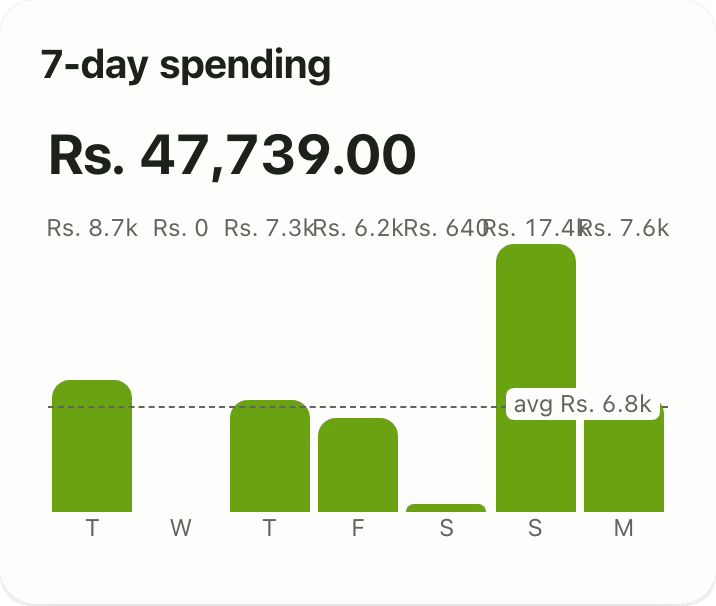
- On a phone the card sits in the same place and fits the screen.
Details and rules
- Free on every plan.
- Always the last seven days, ending today. The week does not follow the month you pick.
- Only the spending bucket counts. Excluded money, tax and transfers do not.
- Amounts are in your default currency.
- You can add it once.
- Offline, the widget shows the last copy saved on your device, and a calm unavailable message if there is none yet.
- Days with no spending show an empty bar, and still count in the average.
Works with
Ask an AI assistant
Ask: “What did I spend each day this week?” The assistant can use list_transactions with a date range, or get_cash_flow for money in and out by day, which needs Premium.
For AI assistants
Lipi’s MCP server gives an assistant these tools for this feature:
get_cash_flowlist_transactions
Questions and answers
What does the 7-day spending widget show?
It shows how much you spent on each of the last seven days as bars, with the amount on each bar and a dashed line for your daily average over the week.
Does it include EMI, insurance or transfers?
No. It shows spending only. Transfers between your own accounts, and money in the excluded and tax buckets, are left out.
Can I change the week or the chart?
No. It always shows the last seven days. The only setting is the card width, Dynamic or Full.
Is the weekly spending widget free?
Yes. It is free on every plan.
Can Lipi show my daily average spending?
Yes. The 7-day spending widget draws a dashed average line across the bars, so you see your daily pace and which days went above it.
Last updated:
More in Dashboard and reports
Reports and summaries
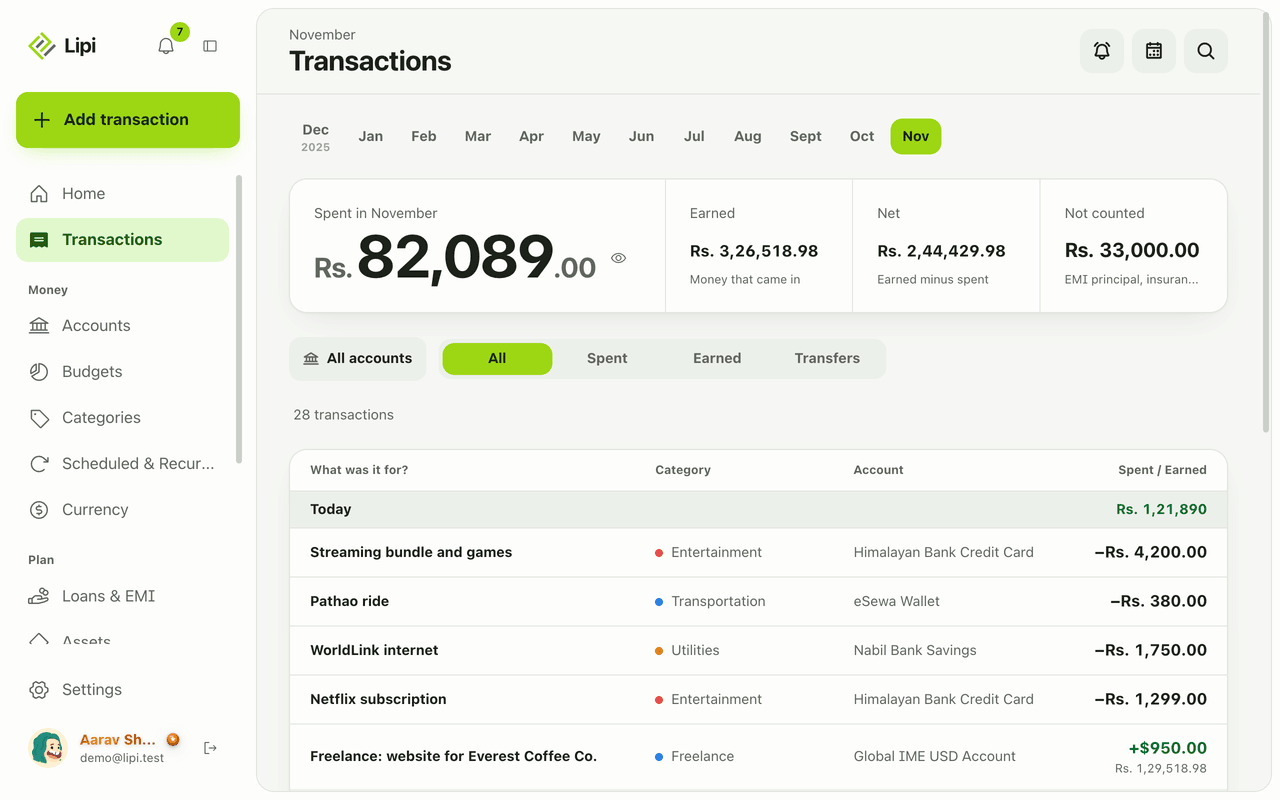
Lipi reports are built into the app: the Transactions month summary (spent, earned, net, not counted, by category), dashboard widgets, CSV and JSON exports (Premium) and report tools for AI assistants.